Built for the people who live in spreadsheets.
From clinical trial timelines to weekly sprint reviews — Pyctura turns any dataset into a report worth sharing.
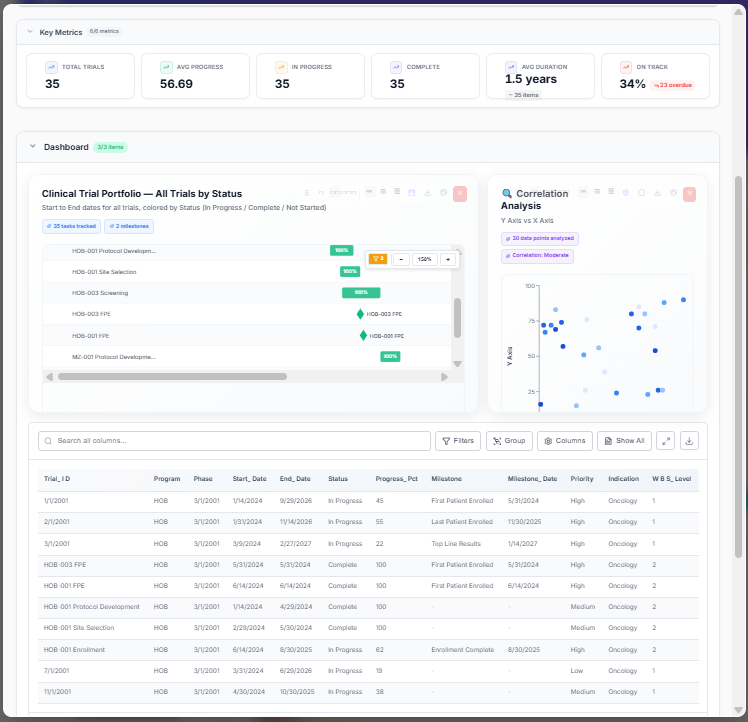
Clinical data. Board-ready in minutes.
Your clinical trial data lives in Excel. Your next board meeting is Friday. Pyctura turns milestone trackers, enrollment data, and trial timelines into Gantt charts and executive summaries — automatically.
- Gantt timelines with phase lanes, milestones, and TODAY marker
- Enrollment progress, completion rates, and schedule risk — auto-detected
- AI executive summary flags delays before your next review
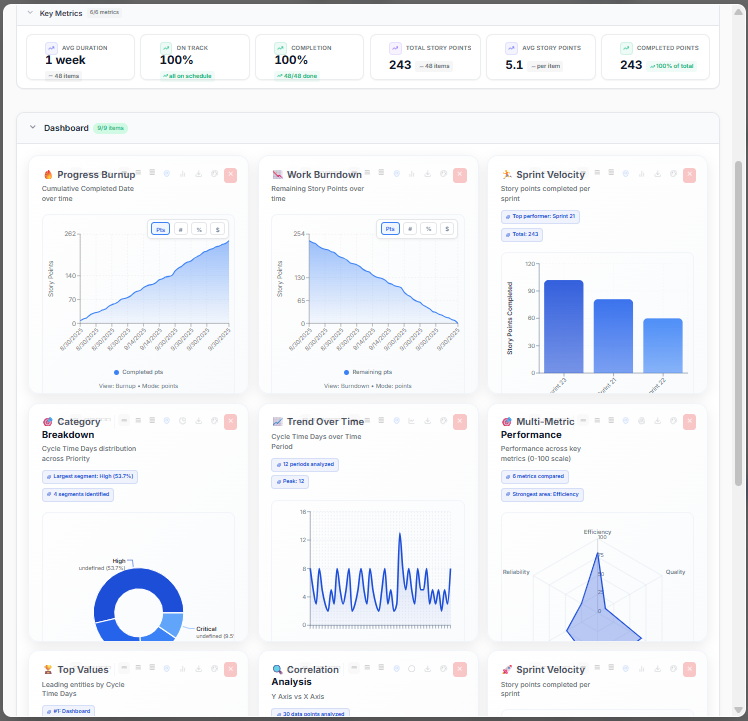
The Gantt chart that didn't take three hours.
Stop rebuilding the same charts every sprint. Drop your Jira export, your MS Project file, or your task CSV. Pyctura builds velocity charts, burndown curves, and sprint timelines — ready for your Monday standup.
- Sprint velocity, burnup, and burndown from any task export
- Gantt timelines from project files — MPP support coming soon
- Multi-sprint comparison and cycle time analysis
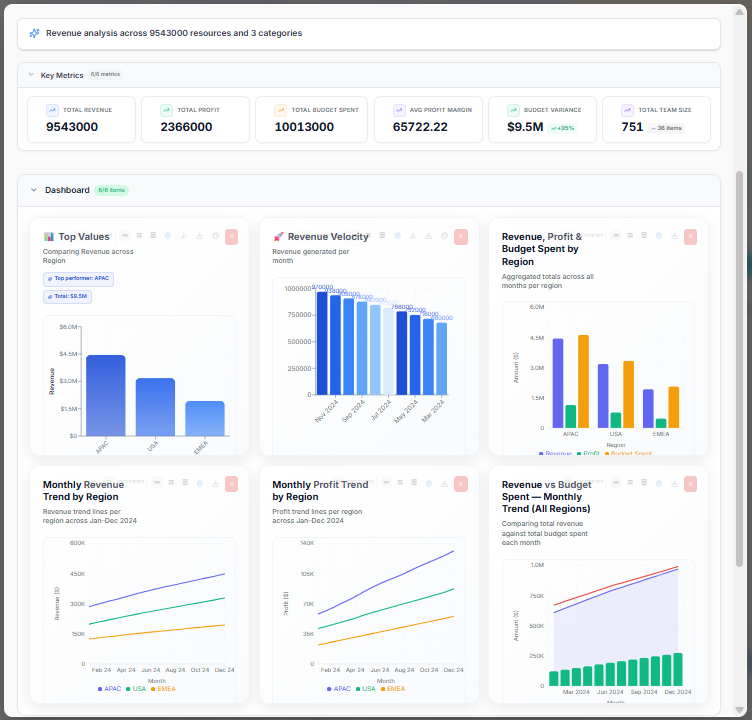
The board deck you used to spend Sunday building.
Revenue, pipeline, burn rate, regional performance — drop your financial data and Pyctura assembles the full picture. KPI tiles, trend lines, regional breakdowns, and an AI summary that tells you what the numbers actually mean.
- Multi-region revenue and profit analysis — auto-detected
- Budget vs actual, variance, and trend lines generated automatically
- AI executive summary writes the narrative for you
Your data is already there. Pyctura finds the story.
Join the beta. Drop a file. See what it looks like in 30 seconds.
Join Beta — It's Free