THE AI REPORTING LAYER FOR CONNECTED WORK

One connected picture from files, tools, and agents.

Pyctura turns scattered spreadsheets, Jira exports, Google Drive folders, Notion pages, and business files into dashboards, timelines, KPIs, executive reports, and reusable Brain context. Start with uploads today, connect sources next, and let agents keep reports current over time.
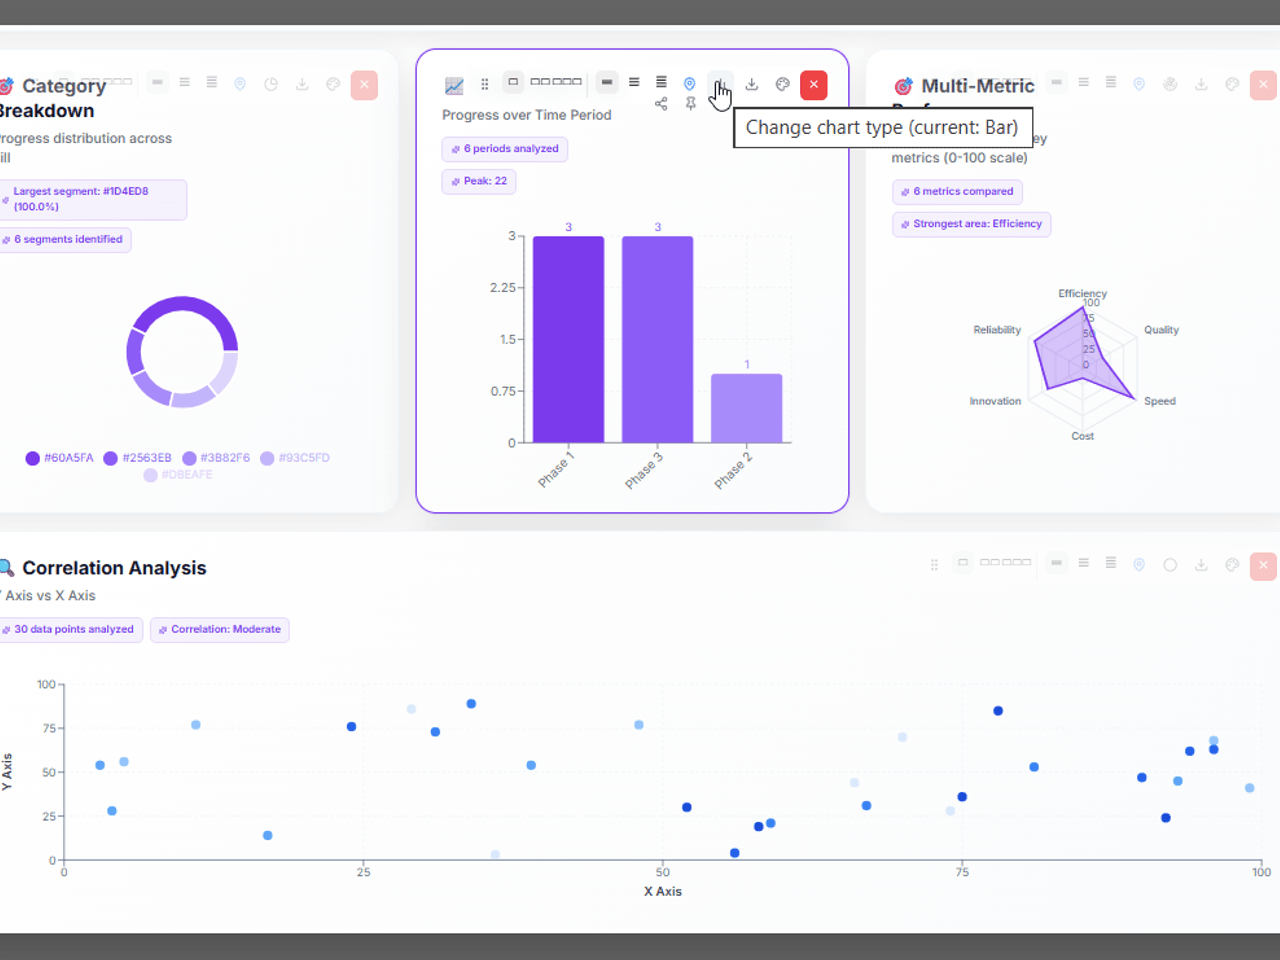
Join Beta
HOW IT WORKS
01
Start with uploads or connectors
Drop in files today, then connect the places work already lives — Google Drive, Notion, Jira, folders, spreadsheets, and future MCP-ready sources.
02
AI builds the connected context
Pyctura reads fields, relationships, timelines, KPIs, risks, decisions, and business meaning across sources before it builds the story.
03
Reports and timelines update themselves
Dashboards, Gantt views, trend charts, KPI summaries, and executive narratives are generated from the connected picture — and can be refreshed as source data changes.
04
Agents keep the Brain current
Pyctura agents can monitor sources, update reports, capture findings, and keep reusable Brain context fresh so every new report starts smarter.
WHAT PYCTURA GENERATES

Reports, timelines, and Brain context from connected work.

Dashboards
KPI tiles, bar charts, line charts, donut charts, scatter plots, radar charts — generated from files, connectors, or agent-refreshed source data.
Gantt & Timeline
Clinical trial milestones, project phases, sprint schedules, and roadmap views — detected from dates, tasks, dependencies, and connected work sources.
Burnup & Burndown
Story points, task completion, remaining work, and delivery trends — built from progress data and updated as the work changes.
Executive Summaries
AI-written observations, risks, decisions, and recommendations generated alongside every report and refreshed as context changes.
Cross-source Analysis
Ask questions across reports, files, Jira exports, folders, and future connectors in one place — without manually stitching data together.
Brain Context
Important reports, pinned insights, findings, and decisions become reusable context for future reports and agent workflows.
HUMAN CONTROL + AGENT ASSISTANCE

Edit it yourself — or let agents keep it current.

Every chart stays editable by humans, but Pyctura is built for agent-assisted reporting too. Agents can refresh report data, update narratives, surface changes, and suggest chart improvements as connected sources evolve.

Change data mapping
Switch chart type
Add or remove charts
Switch to Table view
Resize on dashboard
Change color palette
Export chart
Share to social media
Pin to board
Chart customization — swap chart type, recolor, resize
AI Column Intelligence

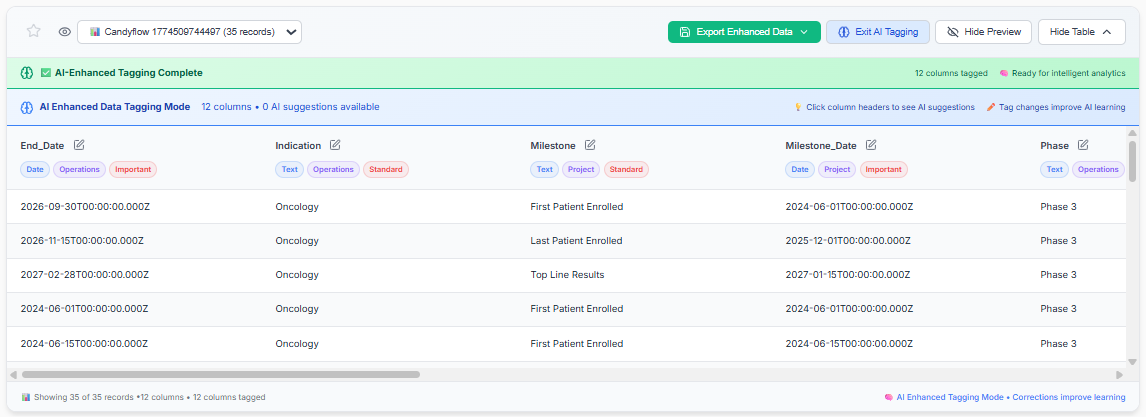
Your data tells Pyctura what it means.

Every Pyctura upload runs through AI column intelligence — data types, business domains, priority signals, all detected automatically. Correct anything. The more you use it, the sharper it gets.

AI classifies every column on upload — domain, type, and business meaning
Override any tag — your corrections feed directly back into the engine
Every report gets sharper the more you work with your data
AI column intelligence tagging in Pyctura
AI Agents — a team of specialists in your workspace
AI AGENTS

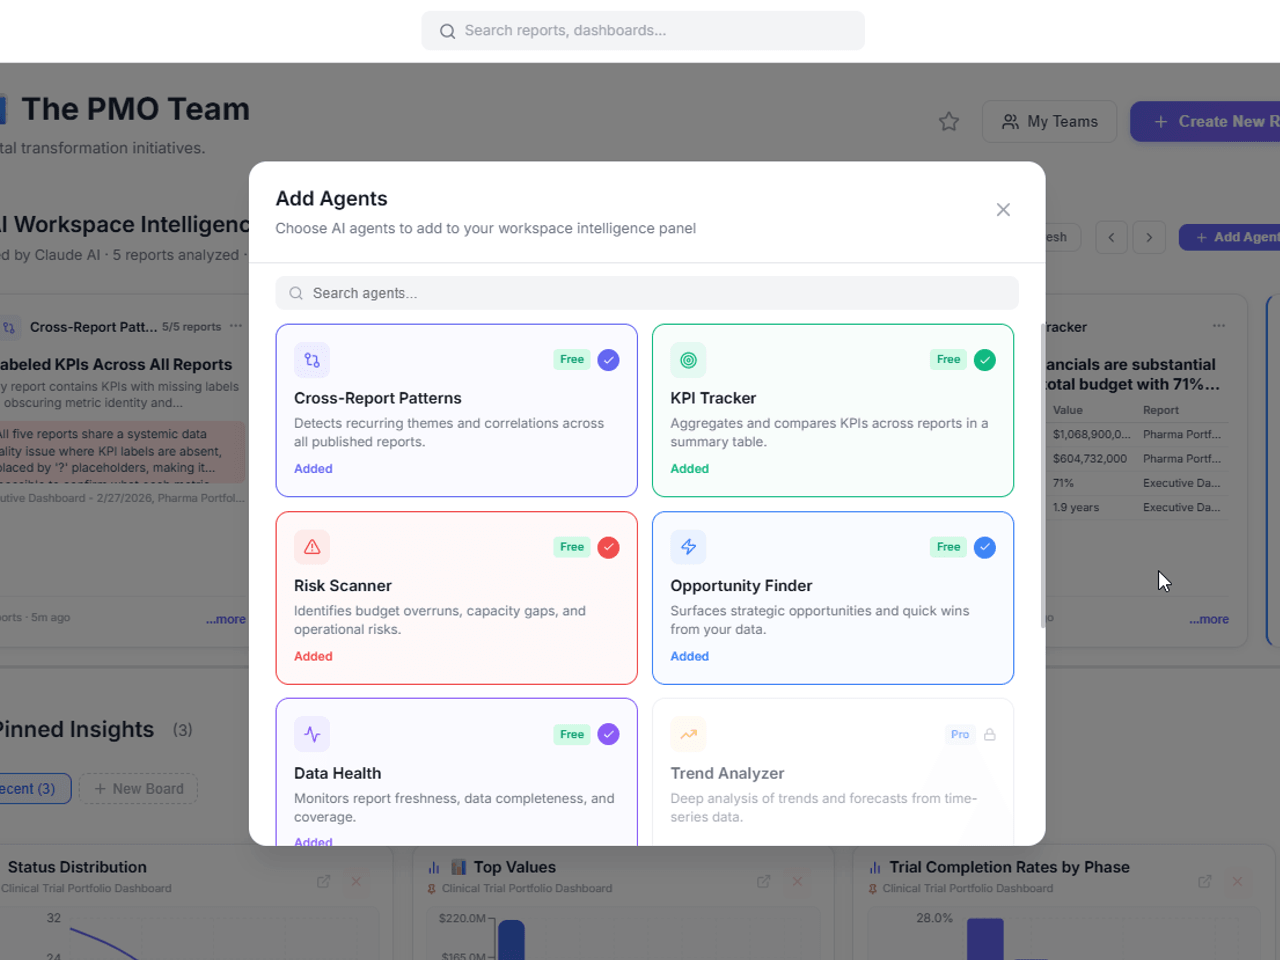
Agents that monitor, refresh, and explain the work.

Pyctura agents are designed to work across your connected sources — starting with files and expanding to Google Drive, Notion, Jira, and MCP-ready tools. They can detect changes, refresh reports, update narratives, and keep your Brain context current.

  • Monitor connected sources for changes and stale reports
  • Refresh dashboards, timelines, and summaries when data changes
  • Capture findings, decisions, and report context into the Brain
SPACES

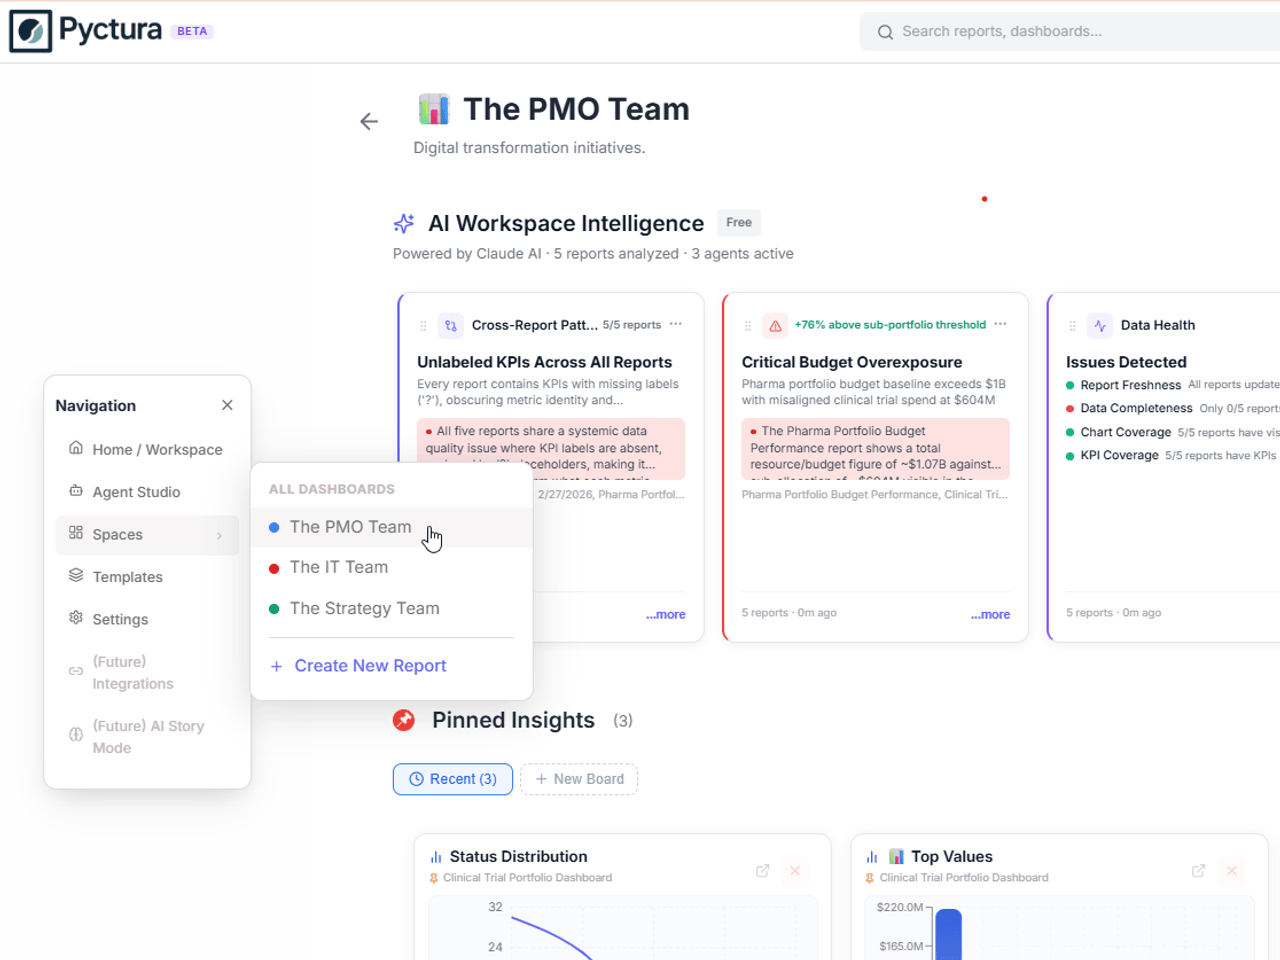
A shared reporting layer for every team.

Spaces organize reports, dashboards, sources, Brain context, and agent-updated findings by team, project, client, or portfolio. Teams get a structured view without forcing every workstream into one system first.

  • Reports, sources, and Brain context organized by team or project
  • Role-based access — Creator, Contributor, Viewer
  • Share human-created or agent-refreshed reports with stakeholders
Spaces — organise reports by team or project
SOURCES PYCTURA CAN WORK WITH

Start with uploads today. As connectors come online, Pyctura is designed to work across the places your operational data already lives.

CSV
XLSX
JSON
Jira exports
Google Drive
Notion
Folders
MCP-ready tools
SharePoint / OneDrive — planned

Ready to see what your data looks like?

Join the beta. Free to start. No credit card required.

Join Beta